slide-image-to-editable-pptx
Convert PPT slide screenshots / style-reference images into a high-fidelity editable PPTX. The output visually matches the source image, but text and simple shapes are PPT-native (editable), while complex visuals are clean generated PNG assets (replaceable). Use when the user provides slide images and wants an editable PowerPoint that looks the same as the source.
Safety scan
A static text scan, not a guarantee. Select the badge to see what was scanned and every finding.
Badge for your README

Markdown
[](/listings/w1163222589-coder-slide-image-to-editable-pptx)HTML
<a href="/listings/w1163222589-coder-slide-image-to-editable-pptx"><img src="/api/listings/w1163222589-coder-slide-image-to-editable-pptx/badge.svg" alt="findsafeskills safety rating" /></a>Install
Install instructions from the README
As written by the repo's author. findsafeskills has not verified these steps.
Installation
Copy the skill folder into your Codex skills directory:
# Clone or download
git clone https://github.com/YOUR_USERNAME/slide-image-to-editable-pptx.git

# Copy to Codex skills directory
cp -r slide-image-to-editable-pptx ~/.codex/skills/
Or install via CC Switch: Skills panel → Add from GitHub → paste the repo URL.
Usage
**Recommended: 3-prompt workflow** (best quality, each phase gets full context window)
**Prompt 1** — Analysis:
Please use the $slide-image-to-editable-pptx skill to convert the slide images
in this folder into an editable PPTX. Visual fidelity must match the source images.
All text must be editable. Complex visuals use $imagegen to generate clean PNGs.
Strictly follow Phase 1 first — complete the analysis including Step 1.4
completeness self-check (ensure no small icons, in-card illustrations, or
decorative details are missed). Output the full element inventory for my review
before proceeding to Phase 2.
**Prompt 2** — Asset Generation:
Proceed to Phase 2. Output the asset report for my review.
Do not proceed to Phase 3 until I confirm.
**Prompt 3** — PPT Assembly:
Proceed to Phase 3. Use @presentations to build the PPTX.
The PNG assets in assets/ are ready. Follow the element inventory in _analysis.md
to reconstruct each slide — match the source images' exact positions, sizes,
and element density. Build slides 1-5 first, render screenshots for my review,
then continue with 6-10, 11-15, etc.
File Structure
your-project/
├── source_slides/           # Your input slide images
│   ├── slide_01.png
│   ├── slide_02.png
│   └── ...
├── assets/                  # Generated PNG visual assets (Phase 2 output)
├── output/                  # Final PPTX (Phase 3 output)
├── _analysis.md             # Element inventory (Phase 1 output)
├── _phase2_assets.md        # Asset generation report (Phase 2 output)
└── validation_report.md     # Quality report (Phase 4 output)
What was scanned
The files the safety scan read, as written by the repository's author and shown as plain text. Lines with a finding are marked.
SKILL.md · Manifest · 240 lines
View this file on GitHub (read at the repository's current version: the scan did not record which commit it read)
This file has changed since it was scanned, so this is not exactly the text that was scanned, and no line is marked. The findings are listed with the safety scan above.
- ---
- name: slide-image-to-editable-pptx
- description: >
- Convert PPT slide screenshots / style-reference images into a high-fidelity
- editable PPTX. The output visually matches the source image, but text and
- simple shapes are PPT-native (editable), while complex visuals are clean
- generated PNG assets (replaceable). Use when the user provides slide images
- and wants an editable PowerPoint that looks the same as the source.
- ---
- # Slide Image → Editable PPTX
- You are converting slide screenshots into editable PowerPoint files.
- The goal is **visual fidelity** — the output PPT, when rendered, should look
- nearly identical to the source image — while making text and geometric shapes
- editable.
- ## Core Principle: Three-Layer Decomposition
- Every pixel in the source image belongs to exactly one of three layers:
- | Layer | What it contains | How to implement | Editable? |
- |-------|-----------------|------------------|-----------|
- | **A — Visual Asset** | Complex illustrations, decorative backgrounds, photos, scientific figures, icons with intricate detail, maps, radar scenes, waveforms, heatmaps, campus sketches, device drawings, textured decorations | Clean PNG generated with `$imagegen` (no text!) or original figure preserved as image | Replaceable (move/resize/delete), not internally editable |
- | **B — Structure** | Solid color rectangles, rounded rectangles, circles, lines, arrows, dividers, panel frames, card backgrounds, badges, gradient bars, simple geometric decorations | PPT-native shapes via `$slides` / `presentation-skill` (PptxGenJS) | Fully editable |
- | **C — Content** | All readable text: titles, subtitles, body text, labels, captions, page numbers, footer text, formula text, table text, card headings, legend labels | PPT-native text boxes via `$slides` / `presentation-skill` (PptxGenJS) | Fully editable |
- **The key insight**: Never bake text into a generated image. Never use crude PPT shapes to approximate a complex visual. Never use a full-slide screenshot as background.
- ## Workflow
- ### Phase 1: Pixel-Level Analysis
- For EACH source image, produce a structured analysis. Do not skip any slide. Do not infer from one slide what another contains — inspect each one.
- #### Step 1.1: Observe and catalog
- Look at the image carefully. Identify every distinct visual element. For each element, determine:
- ```
- {
- "element_id": "s01_e01",
- "description": "distributed radar network illustration with 6 antennas around a central target on a coordinate grid",
- "bbox_percent": {"x": 45, "y": 10, "w": 55, "h": 80},
- "layer": "A",
- "implementation": "image2-generate",
- "z_order": 1,
- "notes": "Must NOT include any text labels. The title, axis labels, and page number are separate text elements."
- }
- ```
- The `bbox_percent` uses percentages of slide width/height (0-100) to specify position. This avoids pixel-count errors across different image resolutions.
- #### Step 1.2: Classify elements strictly
- Apply these rules in order:
- 1. **Is it readable text?** → Layer C (text box). This includes ALL text: titles, labels inside diagrams, axis labels, page numbers, footer text, card headings, bullet points, formula text. Even if text overlaps a complex visual, the text itself goes to Layer C.
- 2. **Is it a simple geometric shape?** (solid rectangle, rounded rectangle, circle, line, arrow, triangle, chevron, trapezoid — with solid fill or simple border) → Layer B (PPT shape). This includes panel backgrounds, card frames, title bars, dividers, badges, progress bars, simple decorative strips.
- 3. **Is it visually complex?** (illustration, photo, texture, gradient background with imagery, scientific figure, diagram with intricate line work, icon with detail beyond basic geometry) → Layer A (generated PNG or preserved figure).
- #### Step 1.3: Identify shared vs. unique elements
- - **Shared across slides**: header bar style, footer style, logo, page number format, background color
- - **Unique per slide**: main content visuals, specific diagrams, data figures
- Create a `slide_master_elements` list for shared elements, and per-slide element lists for unique content.
- #### Step 1.4: Completeness self-check (required)
- After finishing the element list for ALL slides, go back and re-examine each source image ONE MORE TIME with fresh eyes. This second pass focuses specifically on **small or easy-to-miss visual elements** that the first pass may have overlooked.
- For each slide, ask yourself these questions:
- 1. **Small icons**: Are there any small icons (university seals, bullet-point icons, award badges, folder icons, chip icons, person icons, book icons, etc.) that I classified as Layer B (PPT shape) but are actually too detailed for simple shapes? If the icon has more than 3-4 visual features (gradients, shadows, internal detail, curves), reclassify it as Layer A.
- 2. **Decorative details**: Are there small decorative elements I skipped entirely? Look in corners, edges, between cards, along dividers, and in footer/header areas. Things like: small wave patterns, dot grids, circuit-trace textures, line-art campus buildings, faint background motifs.
- 3. **In-card visuals**: For each card/panel on the slide, does it contain a small illustration or diagram inside it? These are frequently missed because the analyst focuses on the card frame (Layer B) and card text (Layer C) but forgets the small visual inside the card.
- 4. **Chart/figure decorations**: Around charts or data figures, are there small visual elements like target icons, antenna icons, signal-path illustrations, or comparison diagrams that I might have grouped with the chart but are actually separate Layer A elements?
- 5. **Count check**: Count the total Layer A elements per slide. A visually rich slide typically has 3-8 distinct visual assets. If a complex-looking slide has only 1-2 Layer A elements, something is likely missing — re-examine it.
- If this second pass finds any missed elements, add them to the element list with a note: `"found_in": "completeness_check"`. Do NOT remove or modify any existing elements — only add.
- ### Phase 2: Visual Asset Generation
- For each Layer A element, generate a clean PNG using `$imagegen`.
- #### `$imagegen` Prompt Rules
- 1. **Be specific about content**: Don't say "a radar scene." Say "A bird's-eye view of a distributed radar network: 6 satellite dish antennas arranged in a hexagonal pattern around a central target (marked with a star), connected by dashed lines, on a dark blue coordinate grid background with axis markings from -200 to 200 km. The style is technical/scientific, with a dark blue (#0A1628) background and light blue/cyan (#31D7FF) elements. No text, no labels, no numbers, no letters."
- 2. **Always end with "No text"**: Every prompt must include "No text, no labels, no numbers, no letters anywhere in the image."
- 3. **Specify exact style**: Reference the color palette, line style, and visual mood from the source image. Example: "Dark technical blueprint style with navy background (#061426), cyan (#31D7FF) glowing lines, subtle grid pattern."
- 4. **Specify aspect ratio**: Match the aspect ratio of the target bounding box. "Aspect ratio approximately 16:9" or "Aspect ratio approximately 1:1".
- 5. **Specify transparency when needed**: "Transparent background (PNG with alpha channel)" for overlay elements. "Solid dark background" for background scenes.
- 6. **One element per image**: Don't combine unrelated visual elements. Generate separate images for separate visual regions.
- #### Asset Naming Convention
- ```
- s{slide_number}_{semantic_role}.png
- ```
- Examples:
- - `s01_radar_network_scene.png` — cover slide's main radar illustration
- - `s01_bottom_wave_decoration.png` — cover slide's bottom decorative wave
- - `s03_system_diagram_center.png` — slide 3's central system model illustration
- - `s05_rmse_chart_figure.png` — slide 5's RMSE result plot (if preserved as figure)
- ### Phase 3: PPT Construction
- Use the **`$slides` system skill** or the **`presentation-skill`** (both based on PptxGenJS) to build the deck. If a presentation skill is installed, prefer it. Do NOT write raw python-pptx code — use whichever PptxGenJS-based skill is available, which provides bundled helpers, rendering, and validation.
- Follow this exact layer stacking order for every slide (add elements in this sequence so z-order is correct):
- ```
- Z-order (bottom to top):
- 1. Slide background color (set via slide.background)
- 2. Full-width structural bars (header band, footer band)
- 3. Large visual assets (background scenes, decorative motifs)
- 4. Panel/card frame shapes (rounded rectangles, boxes)
- 5. Smaller visual assets (icons, figures inside panels)
- 6. Lines, arrows, connectors
- 7. Native charts and tables
- 8. All text boxes (titles, labels, body text, captions)
- 9. Brand elements (logo on top)
- ```
- #### Coordinate Conversion
- Source images are typically at a known pixel resolution (e.g., 1920×1080 or 1672×941). Convert to PowerPoint inches using:
- ```javascript
- const SLIDE_W = 13.333; // inches (16:9)
- const SLIDE_H = 7.5;
- function pxToInches(px_x, px_y, img_w, img_h) {
- return { x: px_x / img_w * SLIDE_W, y: px_y / img_h * SLIDE_H };
- }
- ```
- Measure element positions from the source image precisely. Don't guess.
- #### Font Handling
- - Use "Microsoft YaHei" for Chinese text
- - Use "Cambria Math" for mathematical formulas
- - Match font size, weight (bold), and color from the source image
- - Default to these approximations if unsure:
- - Main title: 28-32pt bold
- - Section title: 20-24pt bold
- - Card heading: 14-16pt bold
- - Body text: 10-12pt regular
- - Caption/label: 8-10pt regular
- - Page number: 10-12pt
- #### Color Extraction
- Extract exact colors from the source image. Provide hex values. Build a color palette object at the top of the script:
- ```javascript
- const COLORS = {
- bg_dark: "0A1628",
- accent_cyan: "31D7FF",
- accent_gold: "C59A4A",
- text_white: "F2FBFF",
- text_muted: "A9C6D8",
- // ... etc
- };
- ```
- #### Rendering and Validation
- After building each slide (or the full deck), use the `$slides` built-in render and validation scripts to:
- - Render each slide to PNG for visual comparison
- - Check for text overflow
- - Check for element overlap issues
- - Check for font substitution problems
- Build one slide at a time. Render and visually compare against the source image before proceeding to the next slide. Fix any significant layout differences before moving on.
- ### Phase 4: Validation
- After building the PPTX:
- 1. **Structural check**: Count objects per slide. Each slide should have:
- - Multiple text frames (not zero)
- - Multiple shapes (not just one big picture)
- - No picture covering >85% of slide area (that would be a full-slide screenshot)
- 2. **Visual comparison**: If possible, render the PPTX to images and compare with source. Flag any slide where:
- - Major elements are missing
- - Layout is significantly different
- - Text is baked into images instead of text boxes
- 3. **Editability check**: Verify that opening the PPTX and clicking on text allows editing.
- ## Non-Negotiable Rules
- 1. **NEVER** use a full-slide screenshot as the background
- 2. **NEVER** bake readable text into generated images
- 3. **NEVER** use a single generic visual motif across many slides when the source slides have distinct visuals
- 4. **NEVER** merge unrelated elements (text + visual + shapes) into one image
- 5. **NEVER** skip the analysis phase — inspect every source image before writing any code
- 6. **NEVER** use crude PPT shapes to approximate complex illustrations when `$imagegen` can generate a proper visual
- 7. **ALWAYS** generate each visual asset without any text
- 8. **ALWAYS** match the source image's color palette, not a generic theme
- 9. **ALWAYS** place text as PPT-native text boxes, even if it overlaps a visual asset
- 10. **ALWAYS** process slides one at a time — each slide gets its own analysis, assets, and build function
- ## Common Failure Modes to Avoid
- ### Failure: "New template" instead of "reconstruction"
- **Symptom**: The output looks like a professional PPT on the same topic, but doesn't match the source image's specific layout.
- **Cause**: Skipping detailed analysis, using generic layouts.
- **Fix**: Measure exact positions from the source image. Match the source's specific element arrangement.
- ### Failure: "Generic motif spam"
- **Symptom**: The same background image appears on every slide.
- **Cause**: Generating one or few generic background images and reusing them.
- **Fix**: Each slide's visual assets should be unique and match that specific slide's source image content.
- ### Failure: "Over-native crude shapes"
- **Symptom**: Complex illustrations (radar dishes, waveforms, network diagrams) rendered as ugly PPT shape approximations.
- **Cause**: Trying to rebuild everything with native shapes when IMAGE2 would produce a much better result.
- **Fix**: Use `$imagegen` for any visual element that PPT shapes can't faithfully reproduce.
- ### Failure: "Baked text"
- **Symptom**: Text visible in the PPTX but not editable — it's part of an image.
- **Cause**: Generated images include text that should be editable.
- **Fix**: `$imagegen` prompts must always specify "no t
README.md · README · 238 lines
View this file on GitHub (read at the repository's current version: the scan did not record which commit it read)
This file has changed since it was scanned, so this is not exactly the text that was scanned, and no line is marked. The findings are listed with the safety scan above.
- <div align="center">
- # Slide Image → Editable PPTX
- ### High-Fidelity Conversion of Slide Screenshots into Editable PowerPoint
- [](https://developers.openai.com/codex/skills)
- [](#compatibility)
- [](LICENSE)
- [](https://github.com/gitbrent/PptxGenJS)
- **Turn slide screenshots into pixel-accurate, fully editable PowerPoint files.**
- Text stays editable. Complex visuals become clean AI-generated PNGs. Simple shapes become native PPT objects.
- English | [中文](README_ZH.md)
- </div>
- ---
- ## The Problem
- You have a set of PPT slide images (screenshots, exported PNGs, or AI-generated mockups) and you want them back as an **editable** `.pptx` file — not a deck of full-slide screenshots pasted as backgrounds.
- Existing approaches fail in predictable ways:
- | Approach | Result |
- |----------|--------|
- | Paste screenshots as backgrounds | Zero editability |
- | Ask AI to "recreate" the PPT | Gets the topic right but layout wrong — a new template, not a reconstruction |
- | Manual recreation | Hours of tedious work per slide |
- ## The Solution
- This skill teaches Codex (or any compatible AI coding agent) to **decompose each slide image into three layers**, then rebuild them as a real PowerPoint file:
- | Layer | Contains | Implementation | Editable? |
- |-------|----------|----------------|-----------|
- | **A — Visual Assets** | Complex illustrations, photos, scientific figures, icons, decorative backgrounds | AI-generated PNG (`$imagegen`) — no text baked in | Replaceable |
- | **B — Structure** | Rectangles, cards, panels, lines, arrows, dividers, badges | Native PPT shapes | Fully editable |
- | **C — Content** | All readable text: titles, labels, body text, page numbers, captions | Native PPT text boxes | Fully editable |
- ## How It Works
- The skill runs in three phases, each in its own context window for maximum quality:
- ```
- ┌──────────────────┐ ┌──────────────────┐ ┌──────────────────┐
- │ Phase 1 │ │ Phase 2 │ │ Phase 3 │
- │ │ │ │ │ │
- │ Pixel-Level │────▶│ Visual Asset │────▶│ PPT Assembly │
- │ Analysis │ │ Generation │ │ & Validation │
- │ │ │ │ │ │
- │ • Inspect each │ │ • Generate PNG │ │ • Build PPTX │
- │ slide image │ │ for each │ │ with native │
- │ • Classify │ │ Layer A │ │ shapes & text │
- │ every element │ │ element │ │ • Render & │
- │ • Map positions │ │ • No text in │ │ compare with │
- │ & layers │ │ any image │ │ source │
- │ • Self-check │ │ • Verify each │ │ • 5 slides per │
- │ for missed │ │ asset │ │ batch │
- │ elements │ │ │ │ │
- └──────────────────┘ └──────────────────┘ └──────────────────┘
- ```
- ### Classification Logic
- This classification step is the heart of the reconstruction process: each visible element is assigned to visual assets, native PPT structure, or editable text before the deck is rebuilt.
- <p align="center">
- <img src="assets/screenshots/10.jpg?v=20260607-1302" alt="Classification logic preview" width="680">
- </p>
- ### Phase 1: Pixel-Level Analysis
- The agent inspects each source image and catalogs every visible element with its type, position (bounding box), layer classification, and implementation method. A **completeness self-check** (Step 1.4) ensures small icons, in-card illustrations, and decorative details are not missed.
- **Output**: `_analysis.md` — a structured element inventory for all slides.
- ### Phase 2: Visual Asset Generation
- For each Layer A element, the agent generates a clean PNG using `$imagegen` with precise prompts that specify content, style, colors, aspect ratio, and transparency — and always end with **"No text, no labels, no numbers."**
- **Output**: `assets/` folder with all generated PNGs + `_phase2_assets.md` report.
- The image below shows Phase 2 in practice: the agent turns identified Layer A elements into clean visual assets before the final PowerPoint assembly.
- 
- ### Phase 3: PPT Assembly
- The agent builds the PPTX using `@presentations` (PptxGenJS), stacking elements in correct z-order: background → visual assets → structural shapes → text boxes → brand elements. Slides are built in batches of 5 with rendering and self-validation after each batch.
- **Output**: Final `.pptx` file + rendered previews + `validation_report.md`.
- ## Quick Start
- ### Installation
- Copy the skill folder into your Codex skills directory:
- ```bash
- # Clone or download
- git clone https://github.com/YOUR_USERNAME/slide-image-to-editable-pptx.git
- # Copy to Codex skills directory
- cp -r slide-image-to-editable-pptx ~/.codex/skills/
- ```
- Or install via CC Switch: Skills panel → Add from GitHub → paste the repo URL.
- ### Usage
- **Recommended: 3-prompt workflow** (best quality, each phase gets full context window)
- **Prompt 1** — Analysis:
- ```
- Please use the $slide-image-to-editable-pptx skill to convert the slide images
- in this folder into an editable PPTX. Visual fidelity must match the source images.
- All text must be editable. Complex visuals use $imagegen to generate clean PNGs.
- Strictly follow Phase 1 first — complete the analysis including Step 1.4
- completeness self-check (ensure no small icons, in-card illustrations, or
- decorative details are missed). Output the full element inventory for my review
- before proceeding to Phase 2.
- ```
- **Prompt 2** — Asset Generation:
- ```
- Proceed to Phase 2. Output the asset report for my review.
- Do not proceed to Phase 3 until I confirm.
- ```
- **Prompt 3** — PPT Assembly:
- ```
- Proceed to Phase 3. Use @presentations to build the PPTX.
- The PNG assets in assets/ are ready. Follow the element inventory in _analysis.md
- to reconstruct each slide — match the source images' exact positions, sizes,
- and element density. Build slides 1-5 first, render screenshots for my review,
- then continue with 6-10, 11-15, etc.
- ```
- ### File Structure
- ```
- your-project/
- ├── source_slides/ # Your input slide images
- │ ├── slide_01.png
- │ ├── slide_02.png
- │ └── ...
- ├── assets/ # Generated PNG visual assets (Phase 2 output)
- ├── output/ # Final PPTX (Phase 3 output)
- ├── _analysis.md # Element inventory (Phase 1 output)
- ├── _phase2_assets.md # Asset generation report (Phase 2 output)
- └── validation_report.md # Quality report (Phase 4 output)
- ```
- ## Key Design Decisions
- ### Why Three Separate Phases?
- AI coding agents have limited context windows (~200K tokens). Running all phases in one shot means each phase gets only a fraction of the available context. Splitting into three phases ensures:
- - **Phase 1** uses full context for thorough analysis
- - **Phase 2** uses full context for high-quality image generation
- - **Phase 3** uses full context for precise PPT code
- ### Why Not Just Use Full-Slide Screenshots?
- Full-slide screenshots give you zero editability. The whole point is to make text editable and shapes adjustable while preserving the visual appearance.
- ### Why Generate Images Instead of Cropping from Source?
- Cropping from slide screenshots produces low-resolution, dirty-edged fragments. AI-generated images are clean, high-resolution, and properly transparent — resulting in a much more professional output.
- ### Why Not Rebuild Everything with Native PPT Shapes?
- Some visual elements (radar scenes, scientific illustrations, campus sketches, decorative textures) are too complex for PPT shapes. Forcing them into shapes produces ugly, crude approximations. AI-generated PNGs preserve visual fidelity.
- ## Common Failure Modes & How the Skill Prevents Them
- | Failure Mode | Symptom | Prevention |
- |-------------|---------|------------|
- | **New template** | Output looks like a different PPT on the same topic | Phase 1 forces pixel-level position measurement |
- | **Generic motif spam** | Same background image on every slide | Each slide gets unique assets matched to its source |
- | **Over-native crude shapes** | Complex visuals rendered as ugly PPT approximations | Classification rules route complex visuals to `$imagegen` |
- | **Baked text** | Text visible but not editable (inside images) | All `$imagegen` prompts end with "No text" |
- | **Missed elements** | Small icons or details missing from output | Step 1.4 completeness self-check catches omissions |
- ## Compatibility
- | Platform | Status | Notes |
- |----------|--------|-------|
- | OpenAI Codex | Fully supported | Primary target. Uses `$imagegen` + `@presentations` |
- | Claude Code | Compatible | Use with appropriate image generation and PPTX skills |
- | Other AI agents | Adaptable | Any agent with image generation + PptxGenJS access |
- ## Examples
- These screenshots show the kind of slide-image reconstruction workflow this skill is designed for: source slides are analyzed visually, rebuilt as editable PowerPoint objects, and checked against rendered previews.
- ### Reconstruction Gallery
- #### Example 1
- 
- #### Example 2
- | Image Version | Editable Version |
- | :---: | :---: |
- |  |  |
- #### Example 3
- | Image Version | Editable Version |
- | :---: | :---: |
- |  |  |
- ## Star History
- [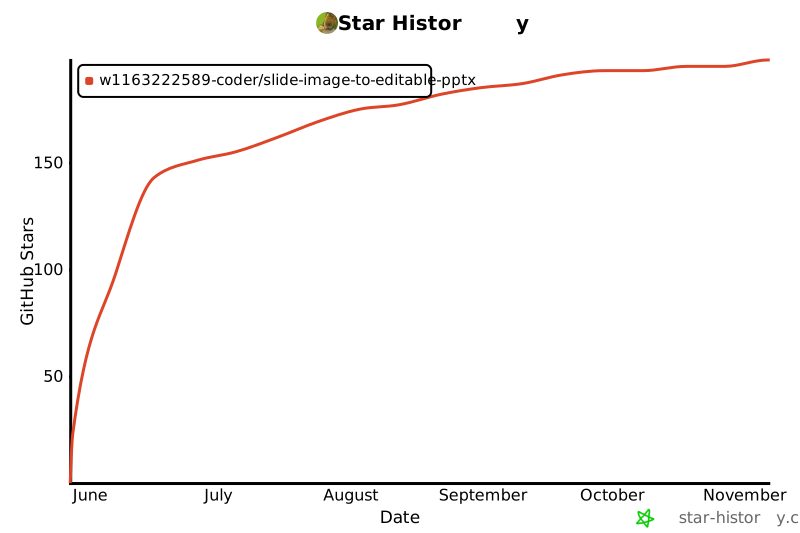](https://star-history.com/#w1163222589-coder/slide-image-to-editable-pptx&Date)
- ## Contributing
- Issues, suggestions, and PRs are welcome!
- If you've used this skill to convert slides and want to share before/after examples, please open a PR — real-world examples help other users understand what to expect.
- ## License
- MIT
- ## Acknowledgments
- - [PptxGenJS](https://github.com/gitbrent/PptxGenJS) — The JavaScript library that makes programmatic PPTX creation possible
- - [OpenAI Codex](https://openai.com/codex/) — The AI coding agent platform
- - [CC Switch](https://github.com/farion1231/cc-switch) — Inspiration for project documentation structure
Ratings and comments
Sign in to rate this skill.
Sign inFree to use. If it’s helped, pass it on.