tufte-data-viz
Agent skill: Edward Tufte's data visualization principles for clean, honest, high-data-ink-ratio charts. Recharts, ECharts, Chart.js, matplotlib, Plotly, D3/SVG.
Safety scan
A static text scan, not a guarantee. Select the badge to see what was scanned and every finding.
Badge for your README

Markdown
[](/listings/caylent--tufte-data-viz)HTML
<a href="/listings/caylent--tufte-data-viz"><img src="/api/listings/caylent--tufte-data-viz/badge.svg" alt="findsafeskills safety rating" /></a>Install
Install instructions from the README
As written by the repo's author. findsafeskills has not verified these steps.
npx skills add caylent/tufte-data-viz
What was scanned
The files the safety scan read, as written by the repository's author and shown as plain text. Lines with a finding are marked.
SKILL.md · Manifest · 233 lines
View this file on GitHub (read at the repository's current version: the scan did not record which commit it read)
- ---
- name: tufte-data-viz
- description: >-
- Use when creating, reviewing, or styling charts, graphs, dashboards,
- sparklines, or any data visualization. Applies to Recharts, ECharts,
- Chart.js, matplotlib, Plotly, seaborn, D3.js, and SVG. Enforces Tufte
- principles (data-ink ratio, direct labeling, range-frame axes) plus
- modern screen-first standards (accessibility, responsive, dark mode).
- allowed-tools: Read, Glob, Grep
- ---
- # Tufte Data Visualization
- Apply Edward Tufte's principles whenever generating or reviewing code that renders data visually. This skill covers chart generation, not slide/presentation design.
- ## Workflow
- Follow these steps in order when creating any chart:
- ### Step 1: Identify the message
- Before writing code, determine:
- 1. The key finding or trend the chart must make visible.
- 2. The comparison context — a baseline, prior period, target, or peer group. A number without context is meaningless.
- 3. The chart type that best fits the data structure (see Chart type guidance below).
- ### Step 2: Apply universal rules
- Review the rules below. Every rule is a default — deviate only when the user explicitly requests otherwise.
- ### Step 3: Apply library-specific config
- Use the Library quick reference table to find the essential overrides for the target library. For complete code examples and helper functions, read ONE rule file from `rules/` matching the library.
- ### Step 4: Validate
- Run through the validation checklist at the bottom of this file before presenting the chart.
- ---
- ## Universal rules
- Rules 1–14 cover static principles; 15–19 extend them for screens; 20–22 address content and formatting.
- ### 1. Remove top and right borders
- No chart should have top or right axis lines, borders, or spines. The bottom and left axes are sufficient. Top and right lines are pure chartjunk.
- ### 2. Direct labels, not legends
- Label each data series directly — at the endpoint of a line, on or beside a bar, next to a cluster. Remove the `<Legend>` component entirely. If there is only one series, the chart title provides that context; no label is needed.
- ### 3. No gridlines by default
- The default is zero gridlines. For static charts where users need to read precise values, add horizontal-only gridlines at very low opacity (0.08–0.12). For interactive charts, prefer a contextual crosshair on hover instead (see rule 15). Never add vertical gridlines.
- ### 4. Range-frame axes
- Axis lines should span only the range of the data, not from zero to some arbitrary maximum. The axis starts at (or near) the minimum data value and ends at the maximum.
- ### 5. No 3D effects
- No perspective, no depth, no shadows on chart elements. Two-dimensional data gets two-dimensional representation.
- ### 6. No pie charts unless explicitly requested
- Default to a horizontal bar chart sorted by value. If the user explicitly asks for a pie chart: maximum 4 slices, 2D only, start at 12 o'clock, direct percentage labels on each slice.
- ### 7. Aspect ratio ~1.5:1
- Charts should be approximately 50% wider than tall. Standard sizes: 600x400, 750x500, 900x600. Exception: sparklines and small multiples may be more compact.
- ### 8. Gray first, highlight selectively
- The default data series color is medium gray (`#666`). Use a single accent color to highlight the most important series or data point. Never use more than 4 distinct colors. Choose the right palette type: **categorical** (4-color muted) for unordered groups, **sequential** (single-hue ramp) for ordered magnitude, **diverging** (two-hue from center) for deviation from a midpoint. See `rules/typography-and-color.md` for hex values.
- ### 9. Off-white background
- Light mode: `#fffff8`. Dark mode: `#151515`. Never use pure white (`#ffffff`) or pure black (`#000000`).
- ### 10. Serif fonts for data
- Use serif fonts for data labels, annotations, and chart titles: `"ET Book", "Palatino Linotype", Palatino, "Book Antiqua", Georgia, serif`. Sans-serif (system-ui, sans-serif) is acceptable only for small axis tick labels (11-12px).
- ### 11. No dual y-axes
- Two y-axes on one chart create false implied correlations. Use small multiples instead — two charts stacked vertically with shared x-axis.
- ### 12. Annotate the notable
- If the data contains a peak, trough, inflection point, or event boundary, add a text annotation pointing to it directly on the chart. Place annotations in the nearest clear space — offset from the data point with a short leader line if needed. When multiple annotations compete for space, keep only the most important; move others to a footnote or tooltip.
- ### 13. Show comparison context
- Include at least one reference element: a reference line (average, target, prior period), a shaded band, or a second series. A chart showing one line with no context fails the "Compared to what?" test.
- ### 14. Minimal tooltips
- Tooltips should be plain text with the data value and label. No colored background, no border, no arrow pointer, no shadow.
- ### 15. Progressive disclosure over static density
- Default to the Tufte-clean overview — high data-ink, minimal chrome. Layer details through hover, tap, and click (values, annotations, comparisons). Don't frontload everything onto a single static view. A contextual crosshair on hover replaces permanent gridlines.
- ### 16. Accessible by default
- 3:1 contrast ratio minimum for chart elements against their background; 4.5:1 for text in charts. Never use color as the sole differentiator — pair with shape, pattern, or direct label. Provide a text alternative for every chart (`aria-label` with key finding, or companion data table). Interactive charts must be keyboard-navigable.
- ### 17. Responsive, not just resized
- Charts must have a responsive strategy — fluid (percentage width + viewBox), adaptive (breakpoint-based layout changes), or hybrid. At narrow viewports, change chart type or layout (horizontal bars for categories, reduced tick density, abbreviated labels), don't just shrink.
- ### 18. Animate to explain, not to decorate
- Transitions for data changes (sorting, filtering, time progression) are good — they help the viewer track transformations. Gratuitous entrance animations, bouncing, and decorative motion are chartjunk. Duration: 200–500ms, ease-out. Always respect `prefers-reduced-motion`.
- ### 19. Dark mode as first-class citizen
- Design both light and dark palettes intentionally. Never invert colors. Reduce saturation in dark mode (bright colors "vibrate" on dark backgrounds). Respect `prefers-color-scheme`. Use semantic color tokens (`--tufte-bg`, `--tufte-text`, `--tufte-series-default`) so charts adapt automatically.
- ### 20. Titles assert findings
- The chart title states the key insight, not the axis description. "Revenue Surged 23% in Q3" not "Revenue by Quarter, 2024". The subtitle can provide context ("vs. prior year, USD millions"). If the data has no clear finding, the chart may not be needed (see rule 22).
- ### 21. Format numbers for humans
- Abbreviate large numbers: $1.2M not $1,200,000. Use thousand separators for mid-range numbers (12,450 not 12450). Match decimal precision to significance (don't show $4.2391M when $4.2M suffices). Right-align numbers in tables. Use consistent units and state them once (in the axis label or title), not on every data point.
- ### 22. Don't chart what a sentence can say
- If the data is 1–2 numbers, write a sentence with inline context ("Revenue was $4.2M, up 23% from Q2"). If the data is a simple ranking of 3–5 items, consider a table. Charts earn their space by revealing patterns, trends, or distributions that text and tables cannot. A chart of two bars is almost always worse than a sentence.
- ---
- ## Library quick reference
- The universal rules above are sufficient for most charts. For complete code examples and library-specific helpers, read the appropriate rule file from the `rules/` directory in this skill's folder. Only read ONE rule file per task.
- | Library | Rule file to read | Essential config (apply even without reading the file) |
- |---------|-------------------|--------------------------------------------------------|
- | Recharts | `rules/recharts.md` | `<CartesianGrid stroke="none" />`, remove `<Legend />`, `<YAxis axisLine={false} tickLine={false} />`, `<Line dot={false} strokeWidth={1.5} />` |
- | ECharts | `rules/echarts.md` | `splitLine: { show: false }`, `legend: { show: false }`, `grid: { show: false }`, use `endLabel` on series |
- | Chart.js | `rules/chartjs.md` | `grid: { display: false }`, `border: { display: false }`, `plugins.legend.display: false`, use `chartjs-plugin-datalabels` |
- | matplotlib | `rules/matplotlib.md` | `spines['top'].set_visible(False)`, `spines['right'].set_visible(False)`, `spines['bottom'].set_bounds(min, max)`, `font.family: serif` |
- | Plotly | `rules/plotly.md` | `showgrid=False`, `showlegend=False`, `plot_bgcolor='#fffff8'`, `zeroline=False` |
- | D3/SVG/HTML | `rules/svg-html.md` | `.domain { display: none }`, no `<rect>` backgrounds, `stroke-opacity: 0.1` for any gridlines |
- ---
- ## Chart type guidance
- | Type | Key settings |
- |---|---|
- | **Line** | 1.5–2px stroke, `dot={false}` unless <7 points (then r=2), direct label at rightmost point |
- | **Bar** | Prefer horizontal for categories, sort by value descending, direct value labels, `#7a7a7a` default fill |
- | **Scatter** | Gray dots `#999` r=3, highlight key cluster/outlier with accent, regression line if meaningful (dashed, thin) |
- | **Time series** | Label events on chart ("Recession", "Launch"), range-frame x-axis, YoY via opacity (current solid, prior 30%) |
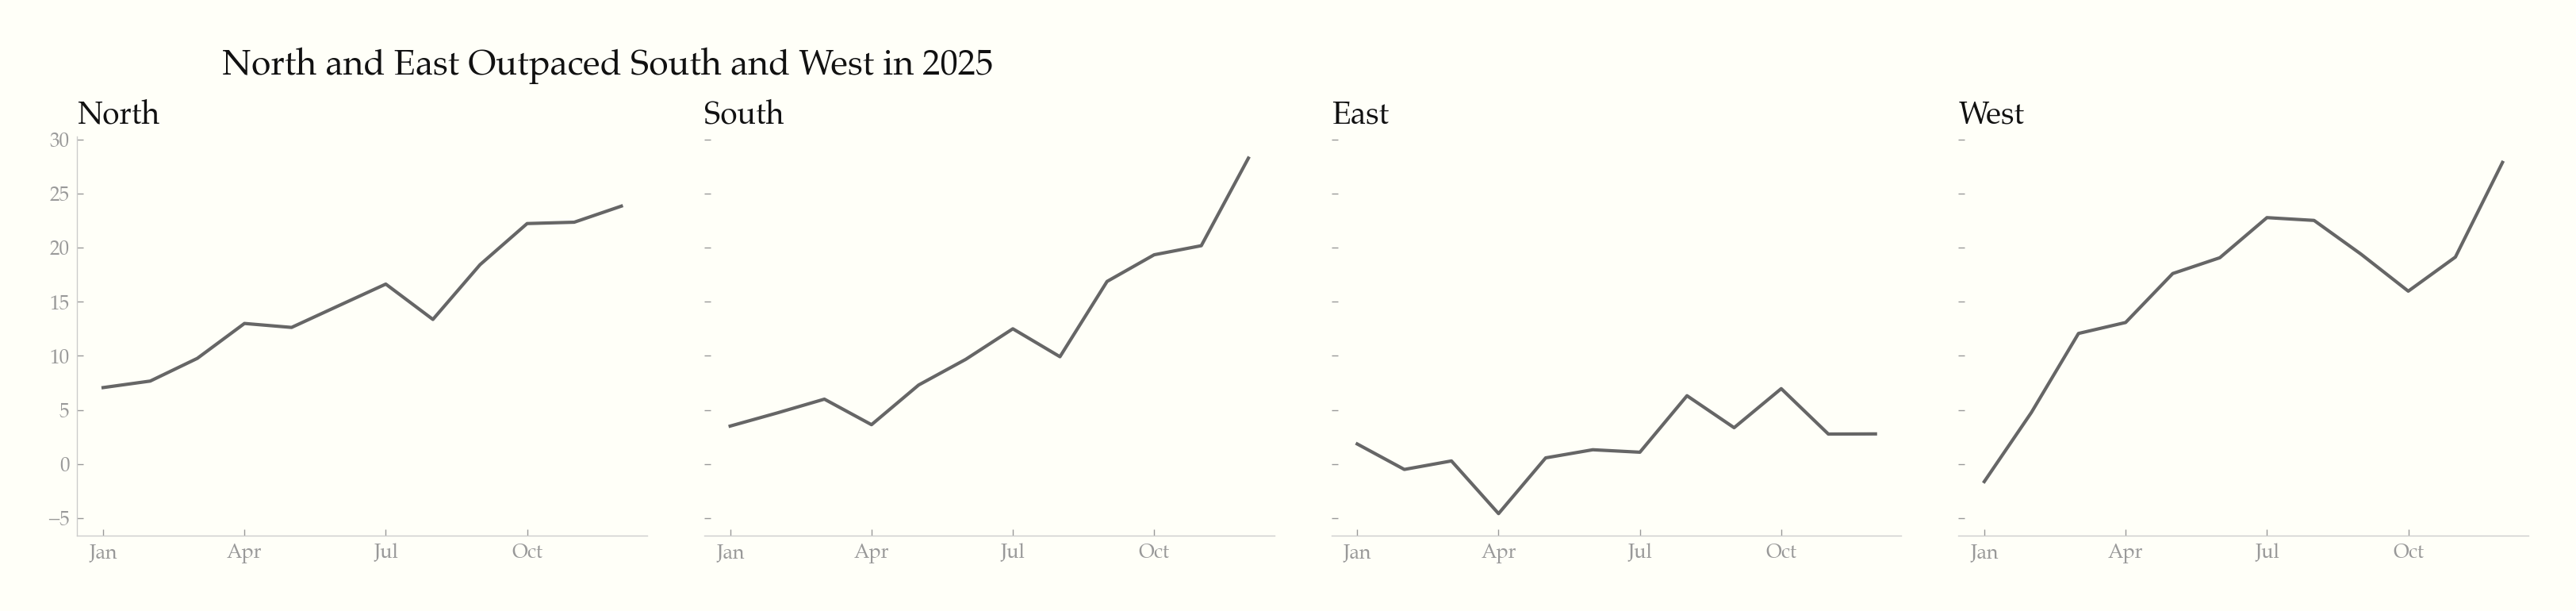
- | **Small multiples** | Same scale ALL panels, shared axis labels (x on bottom row, y on left column), no panel borders |
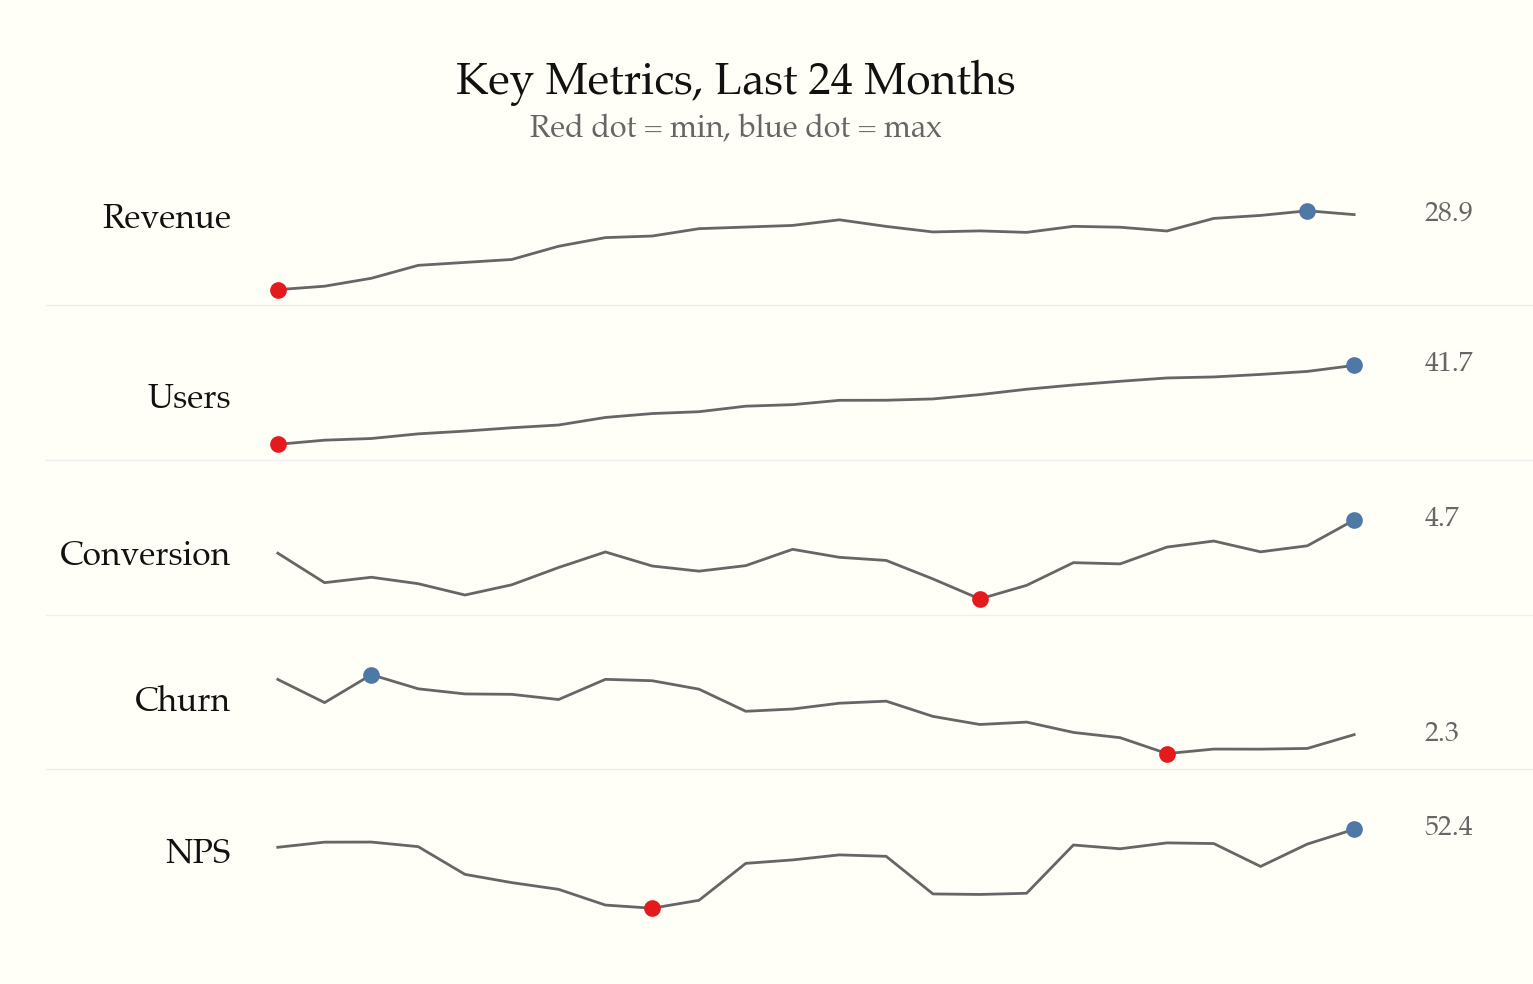
- | **Sparklines** | ~80x20px, no axes/labels/gridlines, min/max dots r=1.5, embed inline in text or table cells |
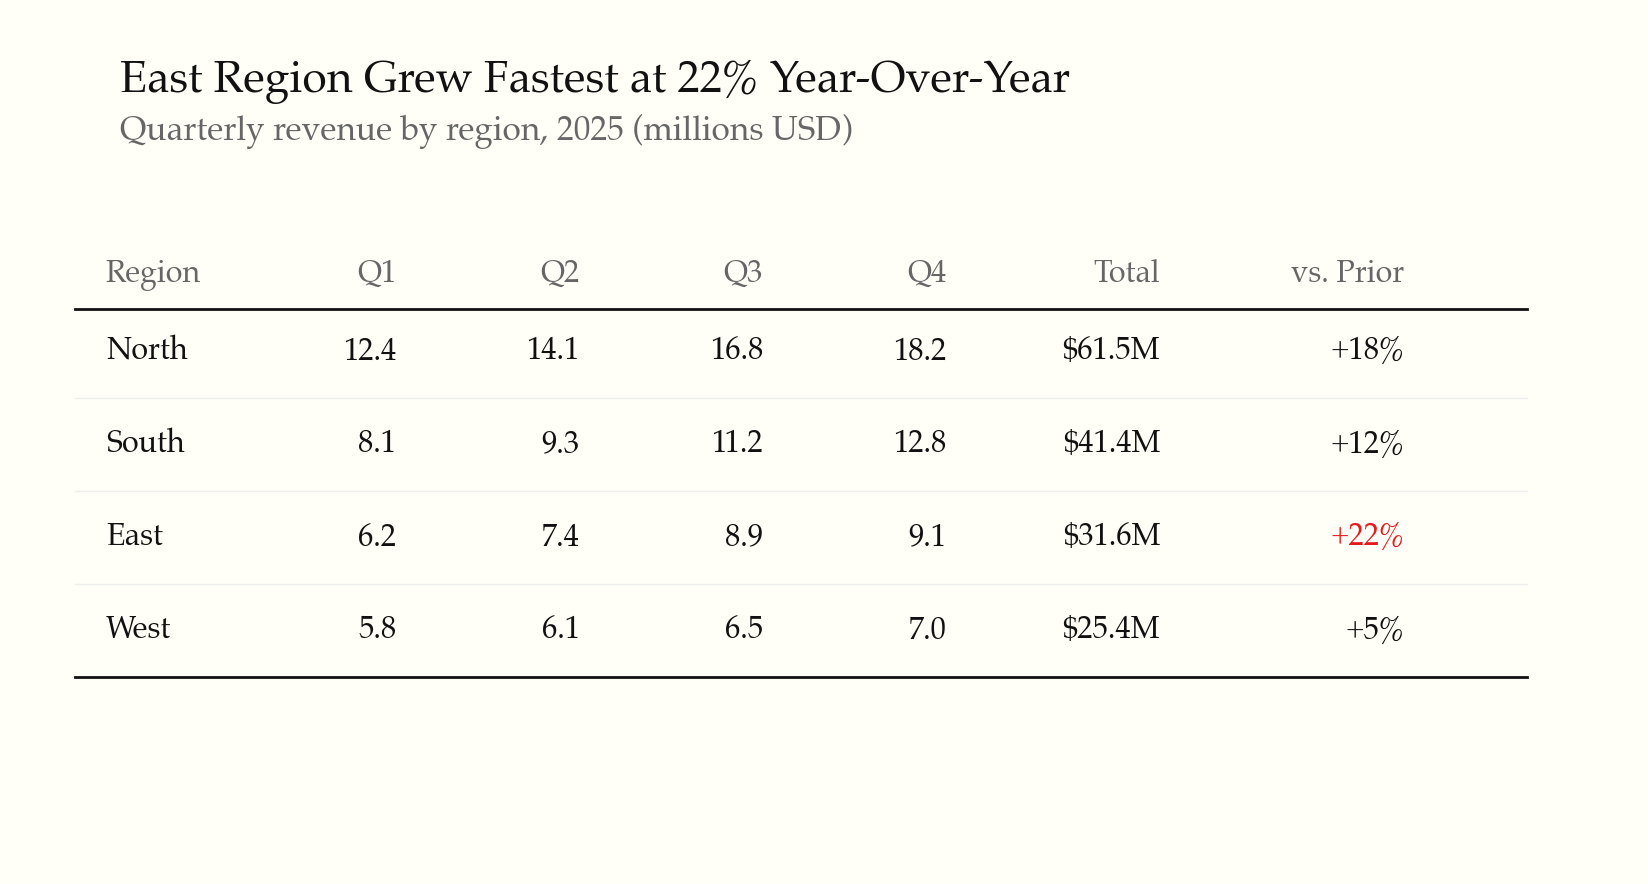
- | **Data tables** | No zebra striping, whitespace + thin rules every 3–5 rows, right-align numbers, `font-feature-settings: 'onum' 1` |
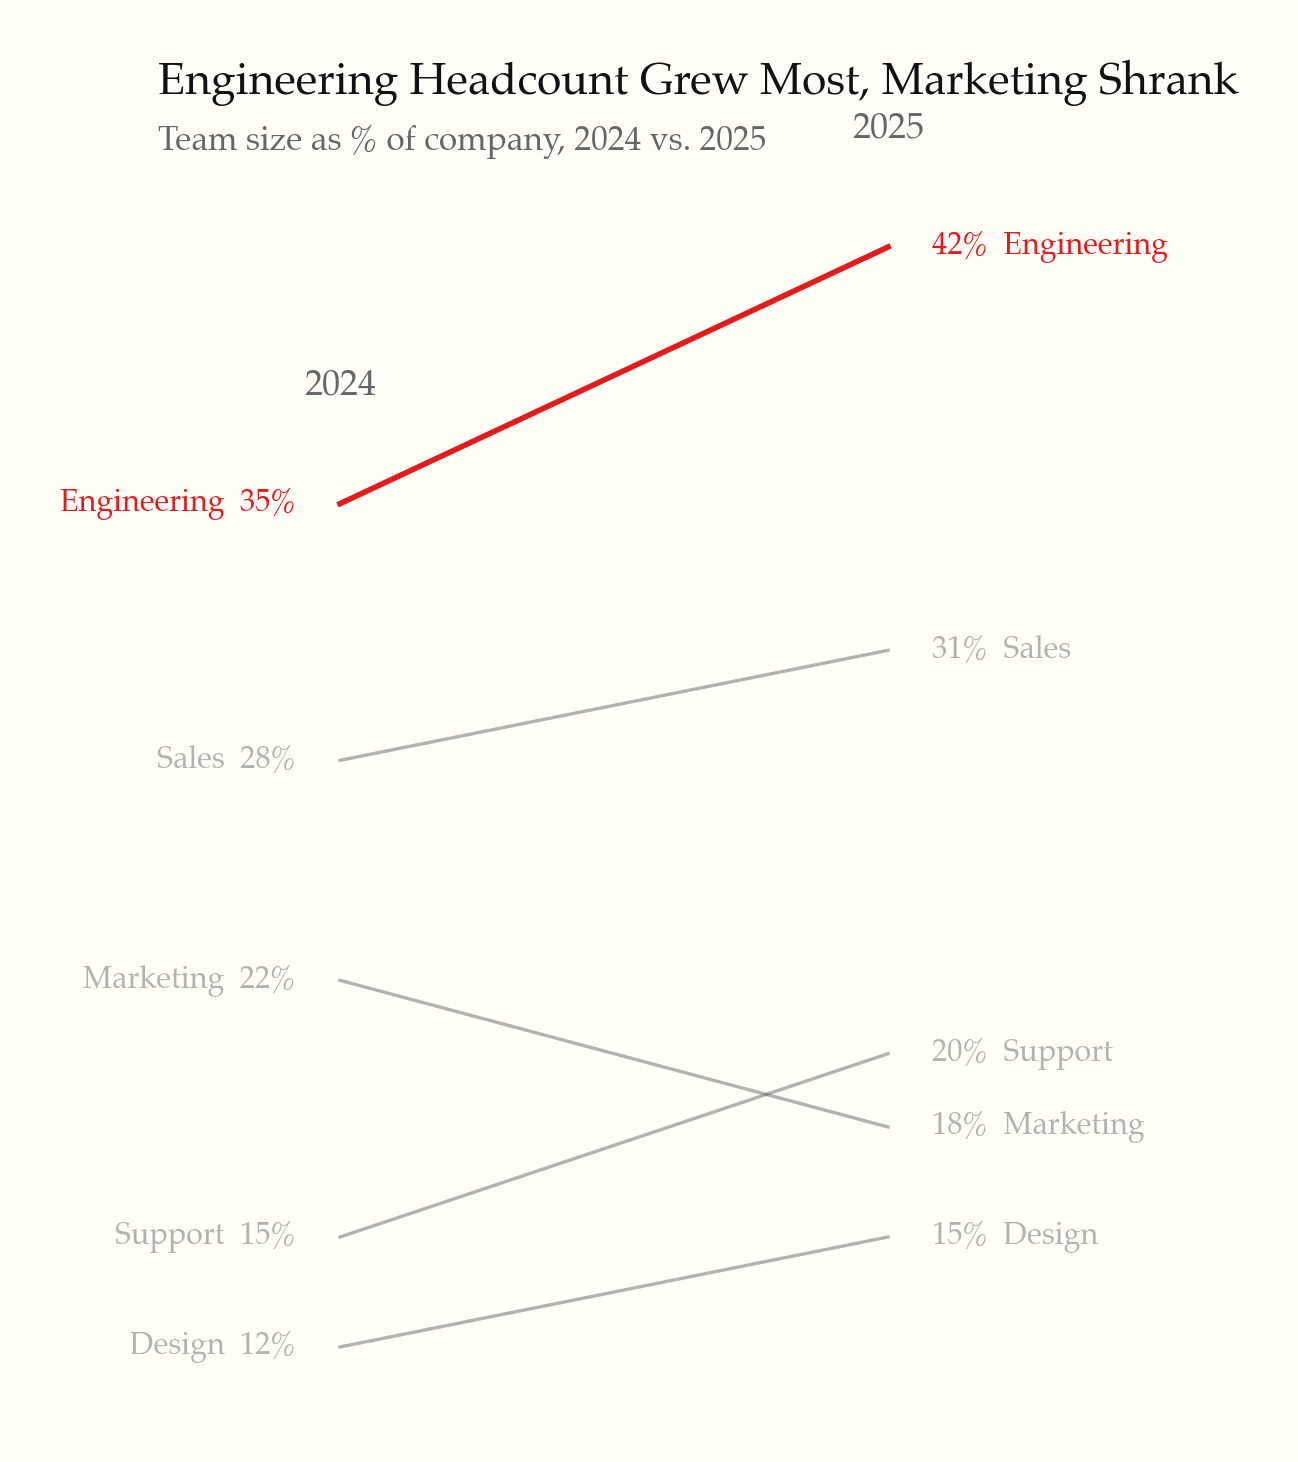
- | **Slopegraph** | Before/after categories, label both endpoints (value + name), gray default + highlight key slopes |
- | **Area** | Prefer lines. If area: fillOpacity 0.03–0.08, no gradient, direct labels at endpoints |
- | **Stacked bar** | Avoid — use small multiples instead. If forced: sort by total, direct labels per segment, max 4 segments |
- | **Heatmap** | Sequential or diverging palette only, value labels in cells, companion data table for accessibility |
- For small multiples, sparklines, and slopegraph implementation patterns, see `rules/small-multiples-sparklines.md`.
- ---
- ## Color quick reference
- | Token | Light | Dark |
- |---|---|---|
- | Background | `#fffff8` | `#151515` |
- | Text | `#111` | `#ddd` |
- | Text secondary | `#666` | `#999` |
- | Axis/rule | `#ccc` | `#444` |
- | Grid (if used) | `#eee` (8-12% opacity) | `#333` |
- | Default series | `#666` | `#999` |
- | Highlight | `#e41a1c` | `#fc8d62` |
- **Categorical (max 4):** `#4e79a7` steel blue · `#f28e2b` tangerine · `#e15759` coral · `#76b7b2` sage
- Font stacks in rule 10. For full palettes (sequential, diverging), font loading, and old-style figures, see `rules/typography-and-color.md`.
- ---
- ## Anti-pattern detection
- When reviewing existing chart code, check for: legends (→ direct labels), pie charts (→ horizontal bars), 3D effects (→ flat 2D), dual y-axes (→ small multiples), heavy gridlines (→ remove or 0.1 opacity), rainbow palettes (→ gray + accent), gauge widgets (→ number + sparkline), gradient fills (→ solid color), rotated labels (→ flip axes or abbreviate), pure white/black backgrounds (→ `#fffff8`/`#151515`), hover-only information (→ tap/focus fallback), missing text alternatives (→ `aria-label`), color-only encoding (→ add shape/pattern).
- For the full table with per-library detection patterns and one-liner fixes, see `rules/anti-patterns.md`.
- ---
- ## Validation checklist
- Before presenting any chart, verify:
- - [ ] No top or right borders/spines
- - [ ] No Legend component — series labeled directly on the chart
- - [ ] Gridlines removed or horizontal-only at opacity <= 0.12
- - [ ] Aspect ratio approximately 1.5:1
- - [ ] Background is `#fffff8` (light) or `#151515` (dark), not pure white/black
- - [ ] Serif font for data labels and titles
- - [ ] Default series color is gray (`#666`); color used only for emphasis
- - [ ] No 3D effects, no pie chart (unless explicitly requested)
- - [ ] Axis lines span only the data range (range-frame)
- - [ ] Notable data features annotated directly on chart
- - [ ] Comparison context present (reference line, band, or second series)
- - [ ] Tooltips are plain text with no decorative styling
- - [ ] Interactive elements have tap/click/focus alternatives (no hover-only)
- - [ ] Contrast ratios meet 3:1 (elements) / 4.5:1 (text) minimums
- - [ ] Chart has a text alternative (aria-label, description, or data table)
- - [ ] Animations respect `prefers-reduced-motion`
- - [ ] Charts render usably at 320px and 1440px+ widths
- - [ ] Title states the finding, not the axis description
- - [ ] Numbers are formatted for readability (abbreviations, separators, consistent precision)
- - [ ] A chart is warranted — the data couldn't be communicated as a sentence or table
- ---
- ## Additional resources
- **Library rules** (read ONE per task): `rules/recharts.md`, `rules/echarts.md`, `rules/chartjs.md`, `rules/matplotlib.md`, `rules/plotly.md`, `rules/svg-html.md` — complete code examples, helpers, and theme registrations.
- **Cross-cutting** (read when specifically needed):
- - `rules/interactive-and-accessible.md` — progressive disclosure, WCAG, responsive, animation, dark mode
- - `rules/typography-and-color.md` — font loading, full palette tables, old-style figures
- - `rules/anti-patterns.md` — per-library detection heuristics and fixes
- - `rules/small-multiples-sparklines.md` — layout patterns for small multiples, sparklines, slopegraphs
- **Working examples** in `examples/` — one per library, plus an inline SVG sparkline.
README.md · README · 116 lines
View this file on GitHub (read at the repository's current version: the scan did not record which commit it read)
- # tufte-data-viz
- An agent skill that applies [Edward Tufte's](https://www.edwardtufte.com/) data visualization principles when generating charts, plots, and graphs. Produces clean, honest, high-data-ink-ratio visualizations across multiple charting libraries — extended with modern screen-first standards for accessibility, responsiveness, and interactivity.
- ## Fair warning
- This skill is **opinionated by design**. It will remove your gridlines, delete your legends, reject your pie charts, and insist on serif fonts. It enforces a specific visual philosophy — Tufte's — not a neutral one. If you want total creative freedom over your chart styling, this is not the skill for you. If you want every chart to come out clean, honest, and readable without thinking about it, read on.
- ## Install
- ```bash
- npx skills add caylent/tufte-data-viz
- ```
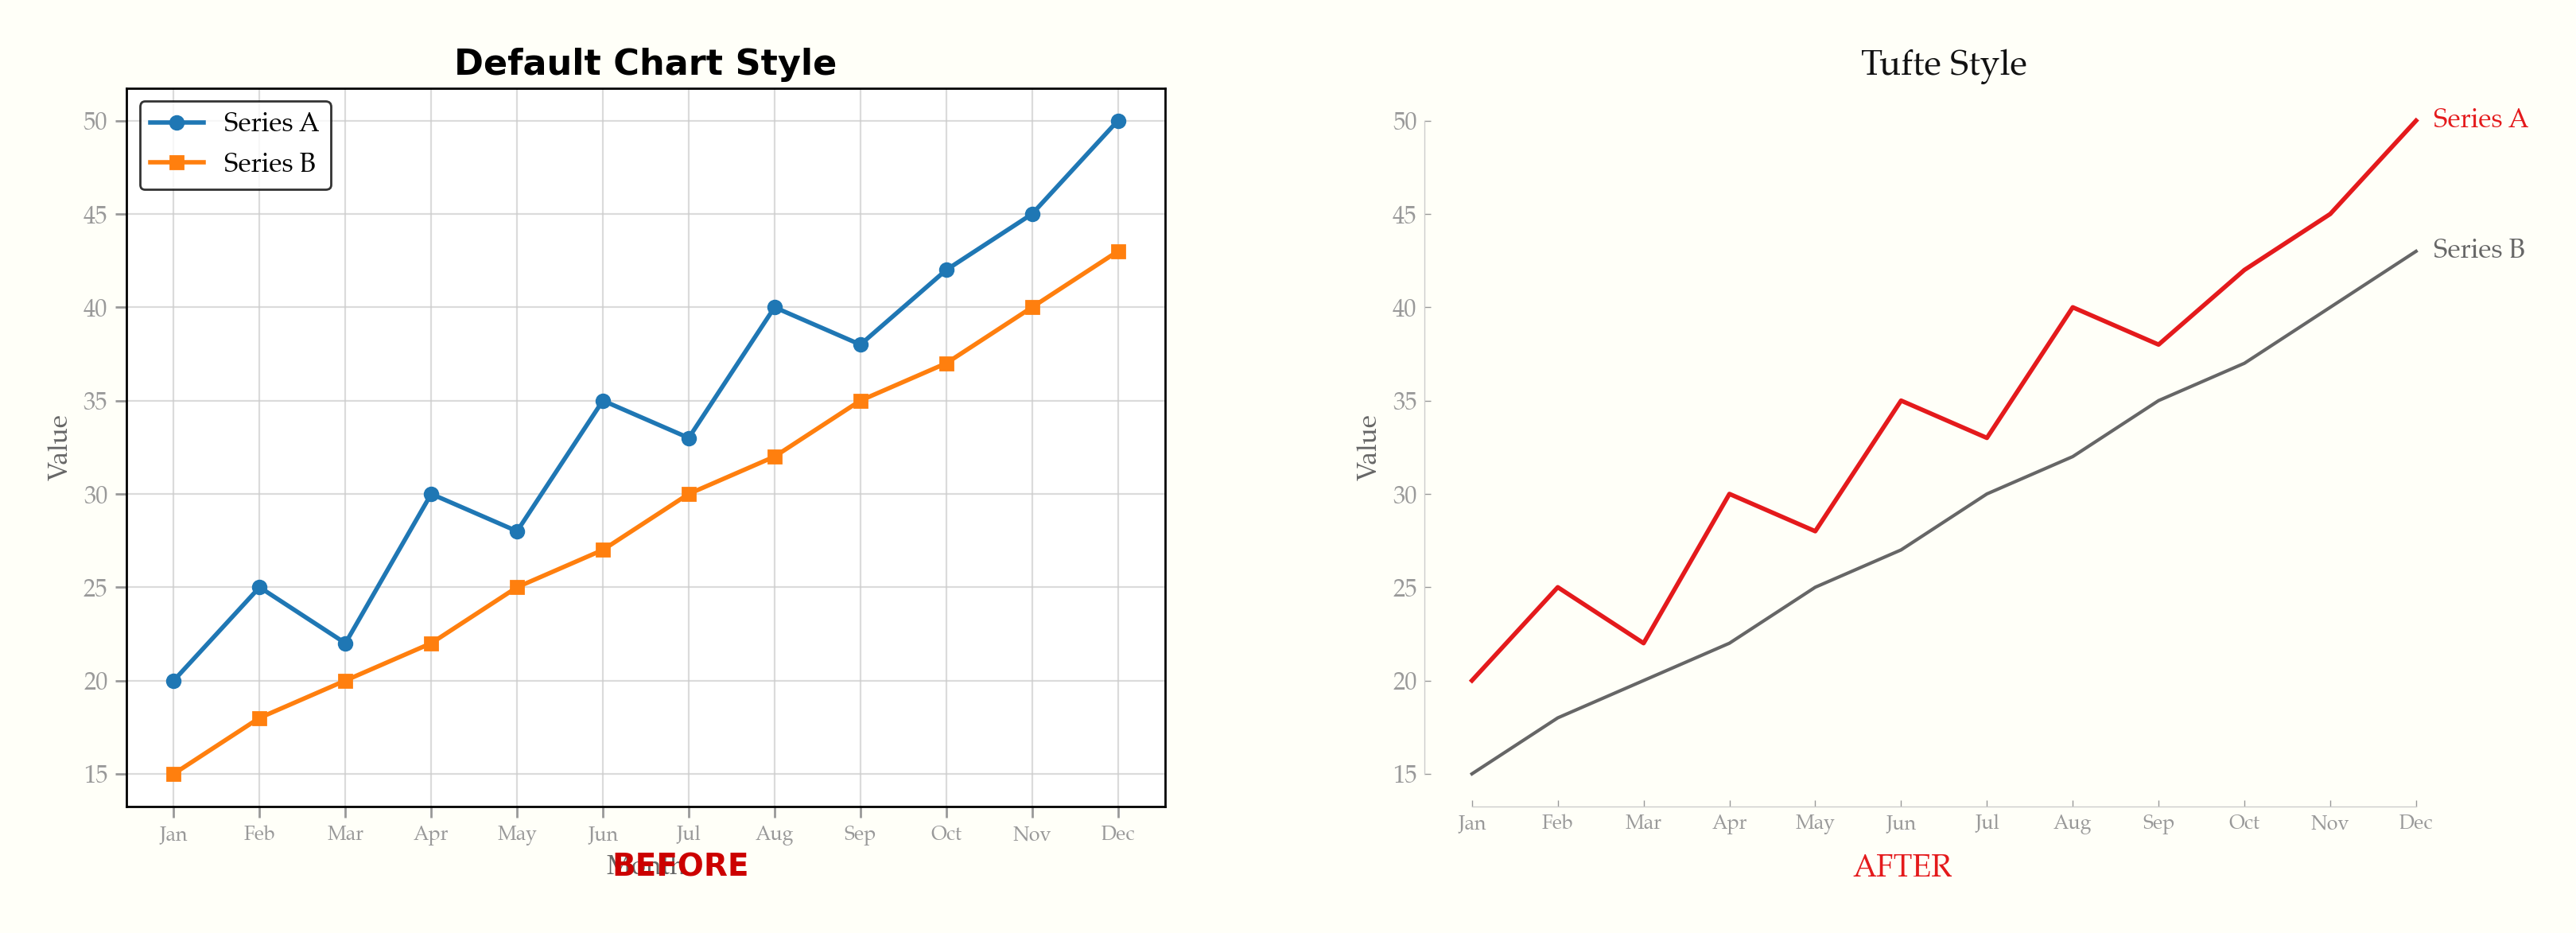
- ## Before & After
- The same data, default styling vs. Tufte principles applied:
- 
- See it happen live — gridlines fade, legends become direct labels, chartjunk dissolves:
- 
- ## Interactive Demo
- **[Try the live demo](https://caylent.github.io/tufte-data-viz/)** — toggle between default and Tufte styling across ECharts, Chart.js, Plotly, and D3.js. Includes dark mode.
- ## Examples
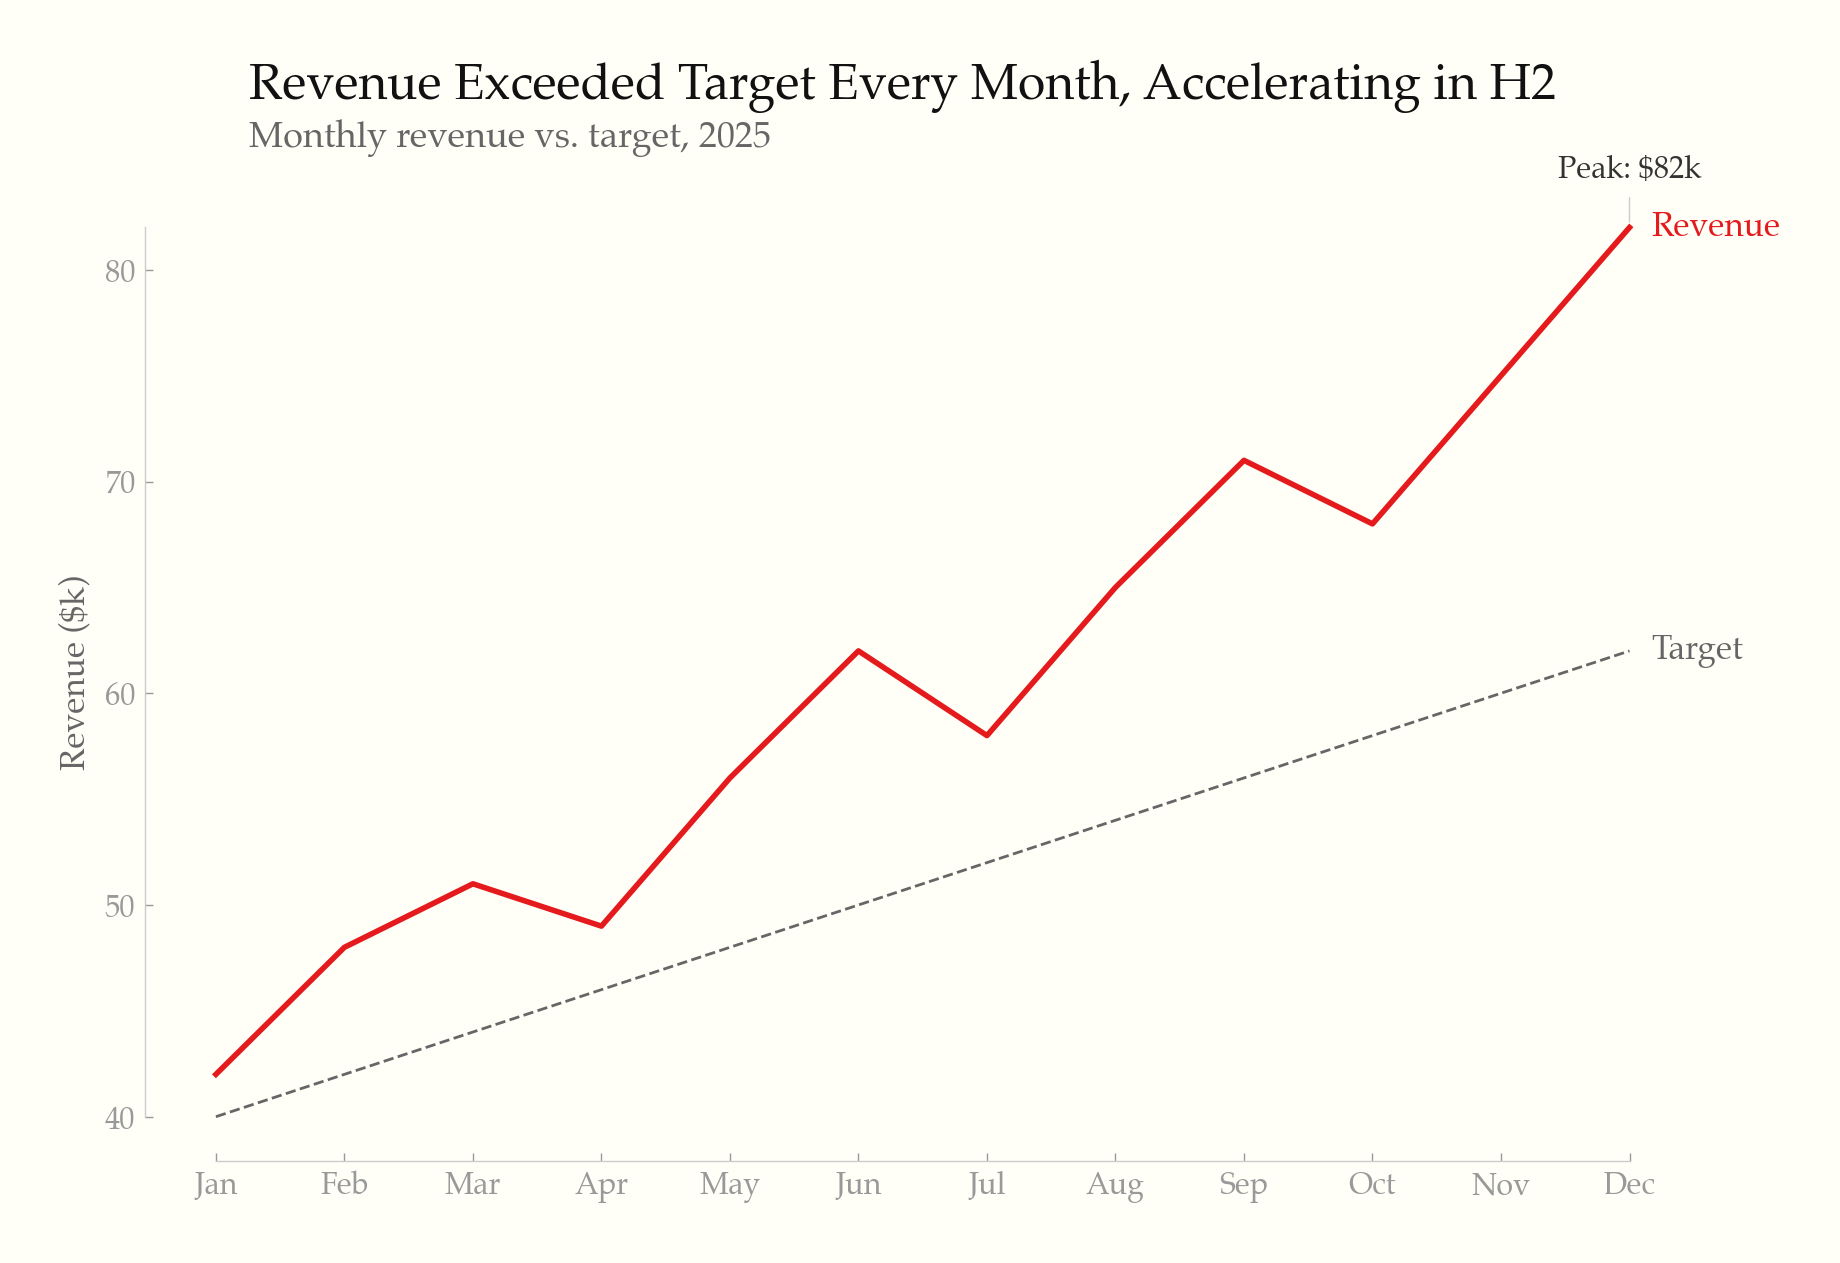
- ### Line chart — direct labels, range-frame axes, annotation
- 
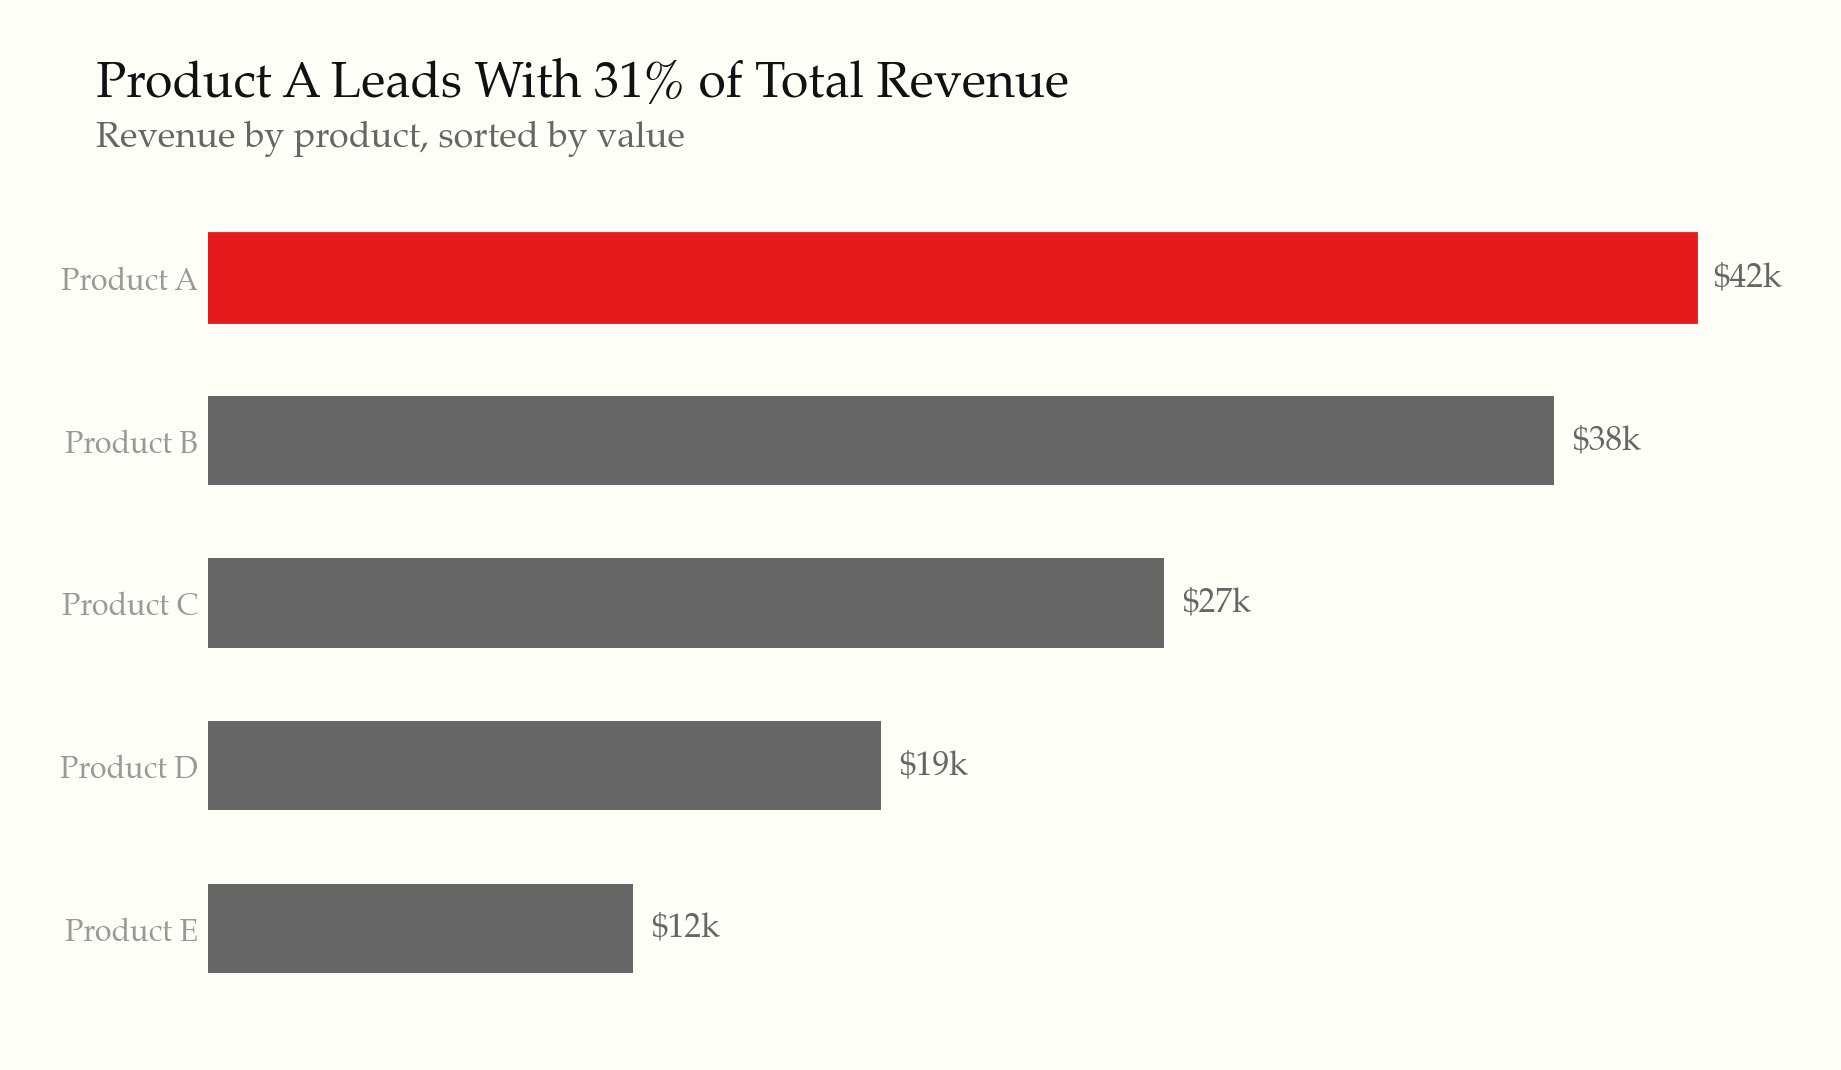
- ### Horizontal bar chart — sorted by value, highlighted leader
- 
- ### Slopegraph — before/after comparison
- 
- ### Small multiples — shared scale, minimal chrome
- 
- ### Sparklines — word-sized charts with min/max markers
- 
- ### Data table — whitespace, thin rules, highlighted outlier
- 
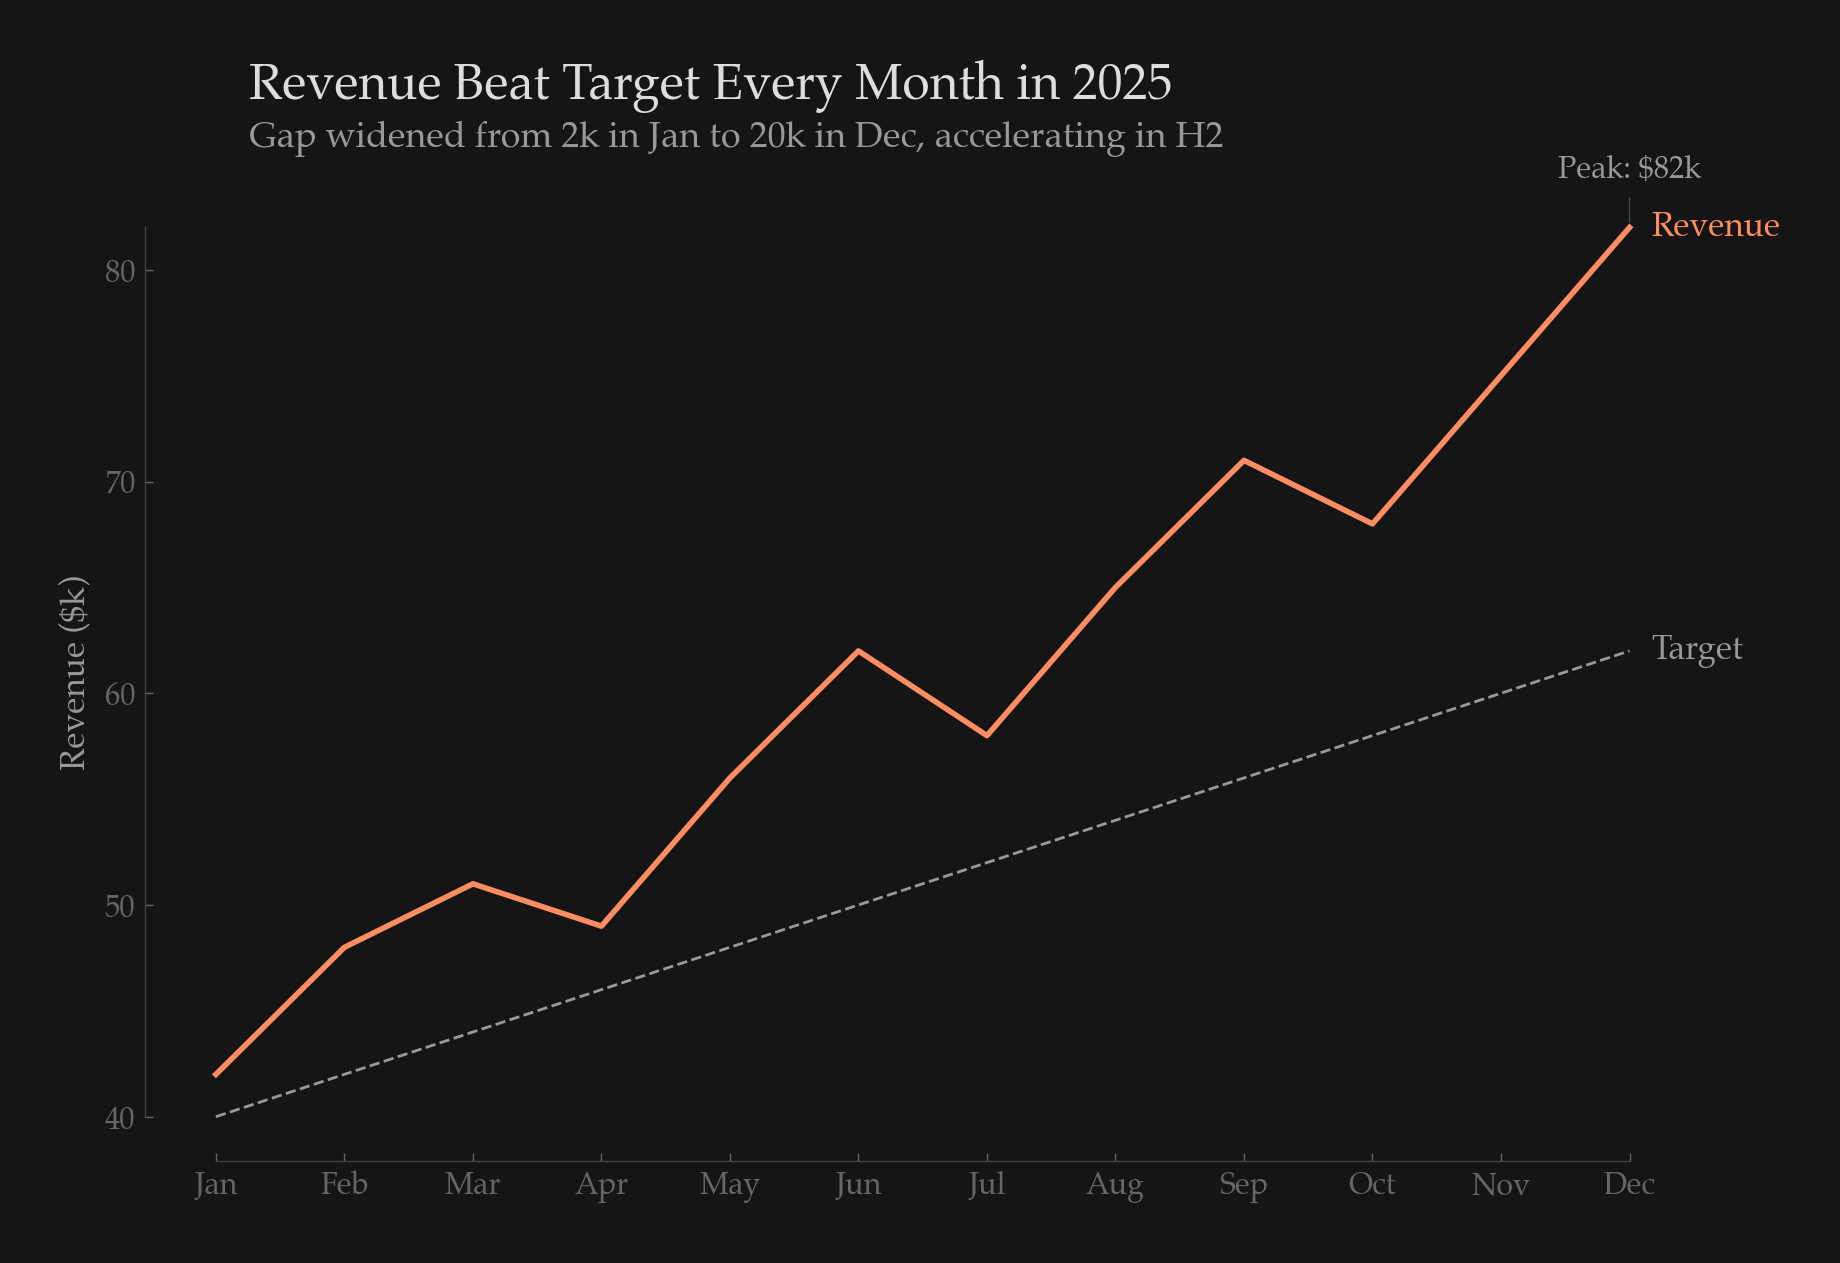
- ### Dark mode — intentional palette, not inverted
- 
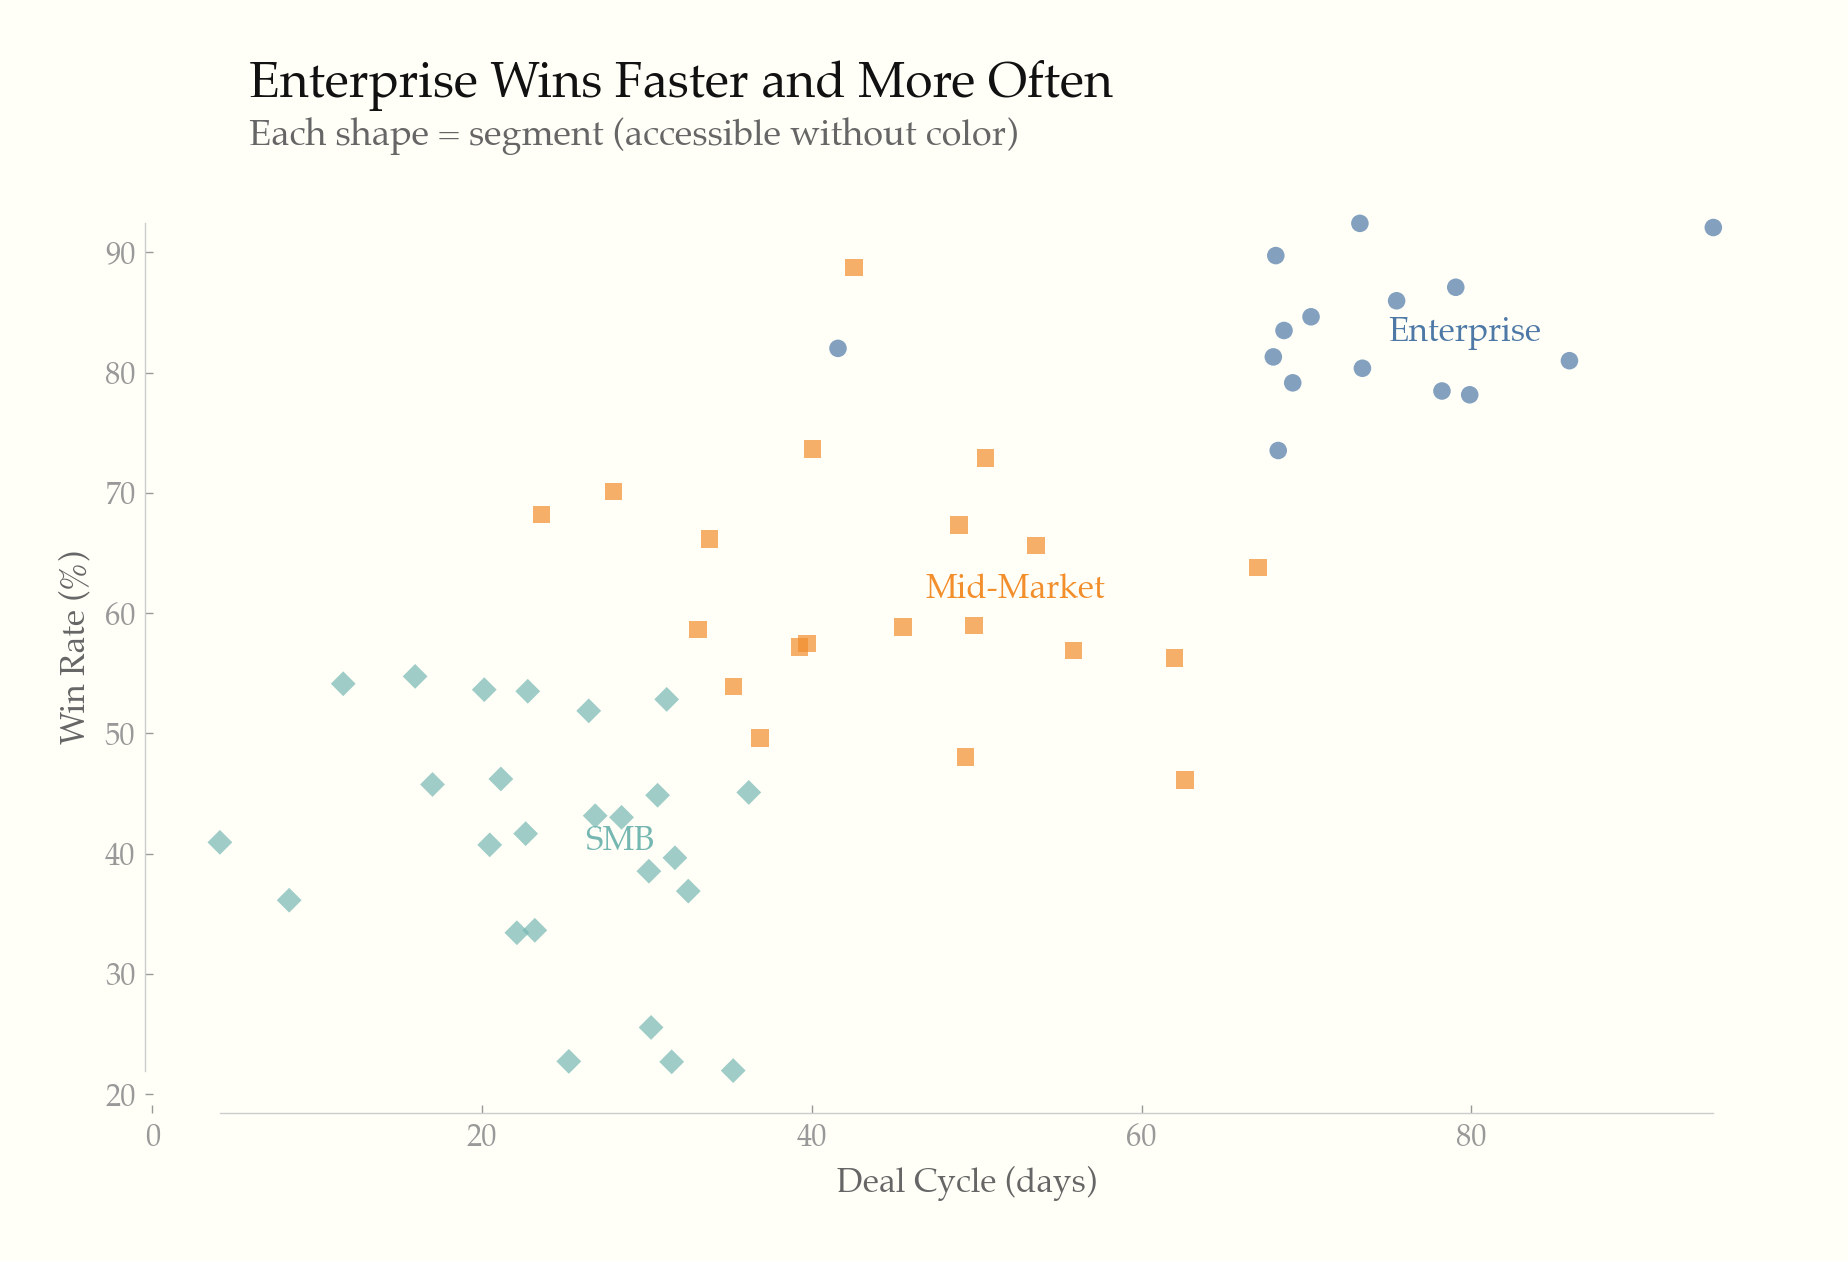
- ### Accessible scatter — dual-encoded with shape + color
- 
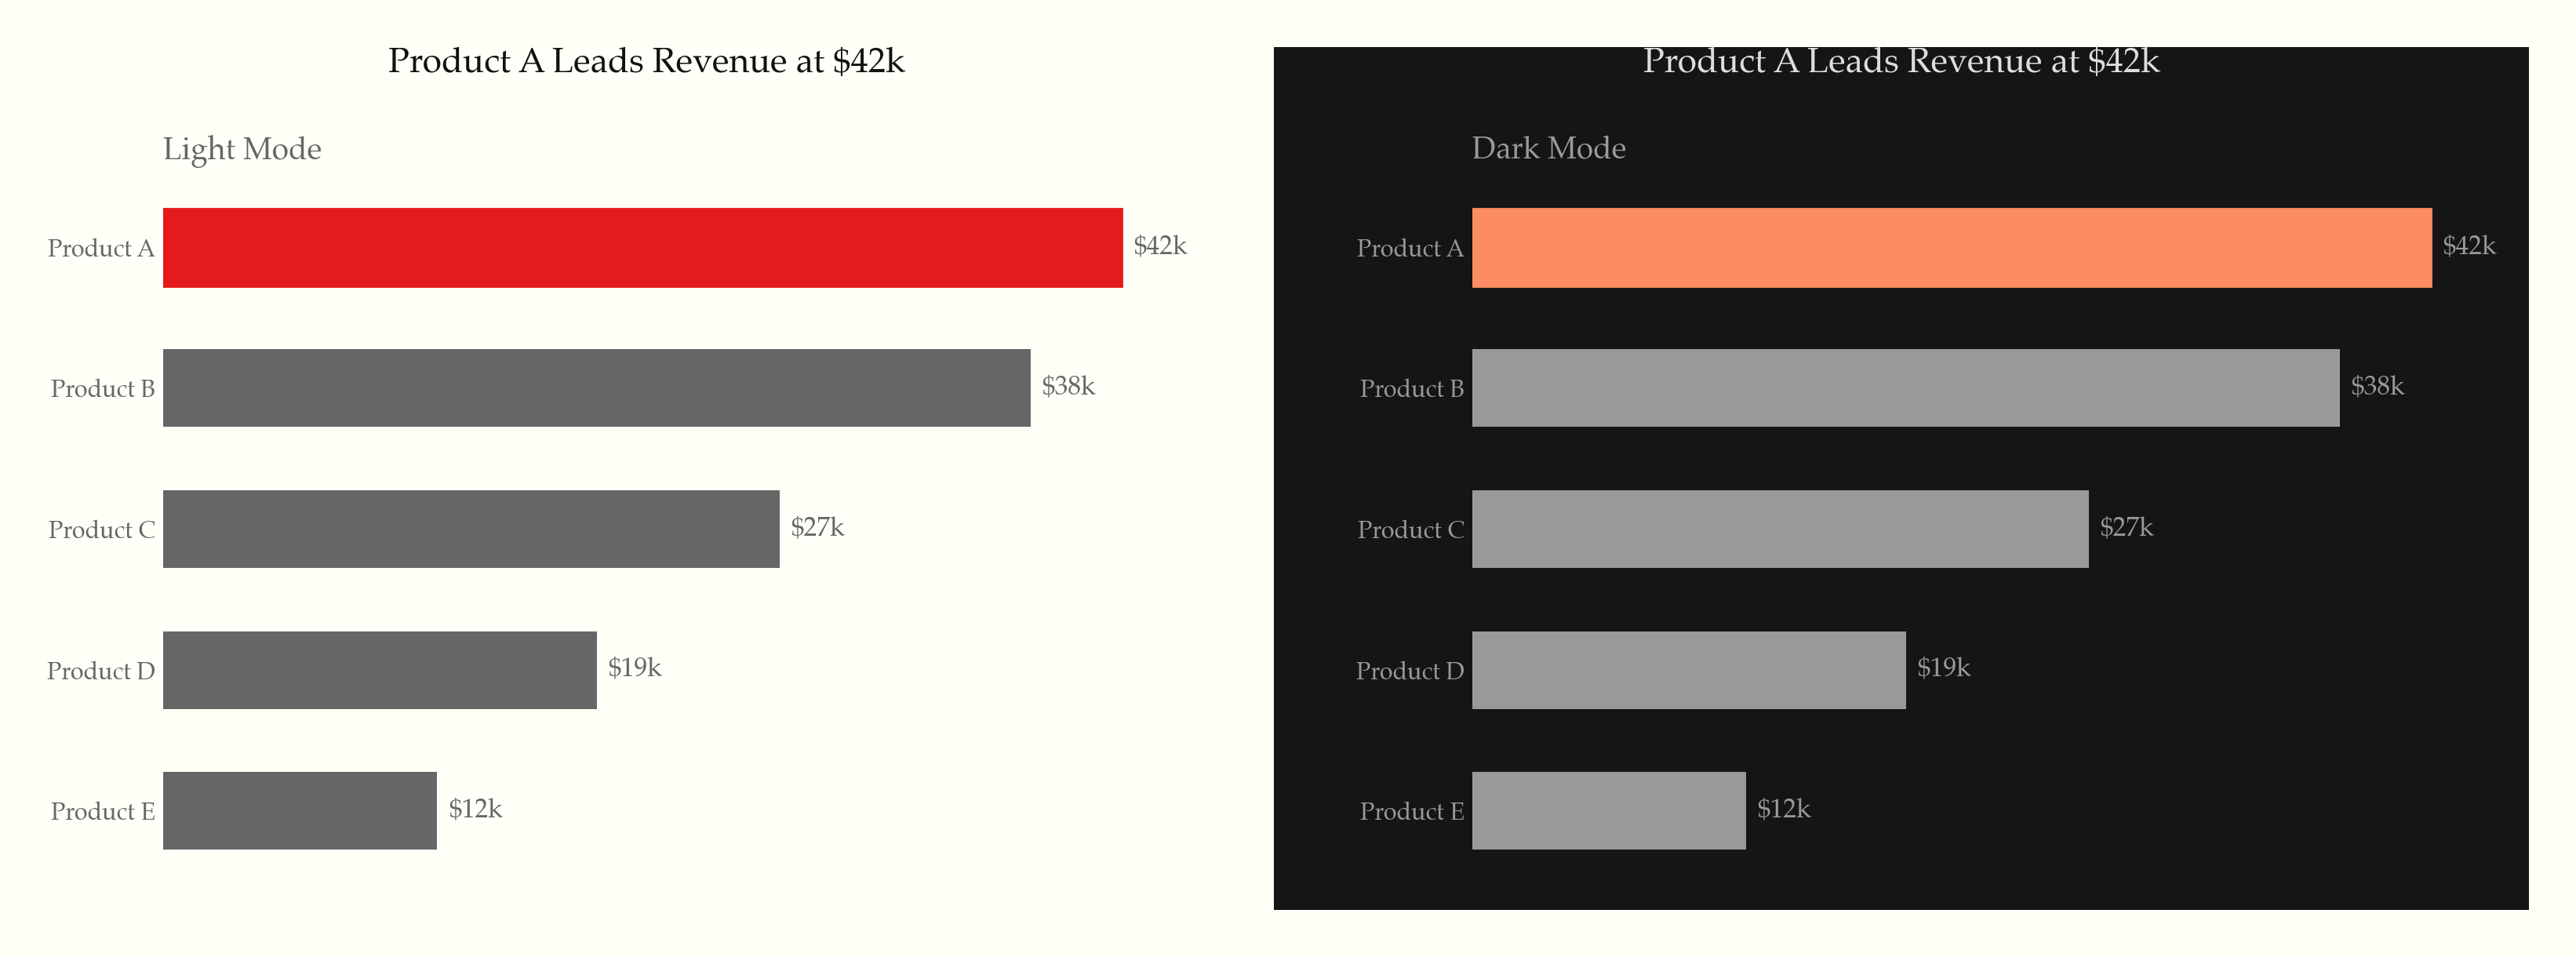
- ### Light & dark — same chart, both themes
- 
- ## What it does
- 22 universal rules applied to every chart, organized in three tiers:
- **Static principles (rules 1–14)** — the Tufte foundation:
- - Maximize data-ink ratio — remove gridlines, borders, legends, and decoration that don't convey data
- - Direct labeling, range-frame axes, no 3D, no pie charts (unless forced), no dual y-axes
- - Serif typography, off-white backgrounds, gray as primary color with selective highlighting
- - Annotate notable features, show comparison context, minimal tooltips
- **Screen-first principles (rules 15–19)** — modern interactive contexts:
- - Progressive disclosure (overview first, details on hover/tap/click)
- - WCAG accessibility (contrast ratios, dual encoding, keyboard nav, screen reader text alternatives)
- - Responsive design (fluid/adaptive strategies, touch targets, mobile-adapted chart types)
- - Purposeful animation (data transitions only, respect `prefers-reduced-motion`)
- - Intentional dark mode (semantic color tokens, never invert, reduce saturation)
- **Content & formatting (rules 20–22)** — what Tufte assumed but never codified:
- - Titles assert findings ("Revenue Surged 23%"), not axis descriptions
- - Numbers formatted for humans ($1.2M, thousand separators, matched precision)
- - Don't chart what a sentence or table can say better
- ## Supported libraries
- | Library | Rule file | Language |
- |---------|-----------|----------|
- | [Recharts](https://recharts.org/) | `rules/recharts.md` | React/JSX |
- | [ECharts](https://echarts.apache.org/) | `rules/echarts.md` | JavaScript |
- | [Chart.js](https://www.chartjs.org/) | `rules/chartjs.md` | JavaScript |
- | [matplotlib](https://matplotlib.org/) | `rules/matplotlib.md` | Python |
- | [Plotly](https://plotly.com/) | `rules/plotly.md` | Python/JS |
- | D3.js / SVG / HTML | `rules/svg-html.md` | Web |
- ## Additional references
- - `rules/interactive-and-accessible.md` — progressive disclosure, accessibility, responsive, animation, dark mode
- - `rules/typography-and-color.md` — font stacks, palettes, hex values
- - `rules/anti-patterns.md` — common violations and one-liner fixes
- - `rules/small-multiples-sparklines.md` — small multiples, sparklines, slopegraphs
- ## Based on
- - *The Visual Display of Quantitative Information* (1983)
- - *Envisioning Information* (1990)
- - *Visual Explanations* (1997)
- - *Beautiful Evidence* (2006)
- ## License
- MIT
Ratings and comments
Sign in to rate this skill.
Sign inFree to use. If it’s helped, pass it on.